
~70%
Global freshwater withdrawals associated with agriculture
Source · FAO AQUASTAT
Explore how major companies use, manage, and report water, then use the evidence to make more informed choices about the businesses you support.
Explore Water Actions →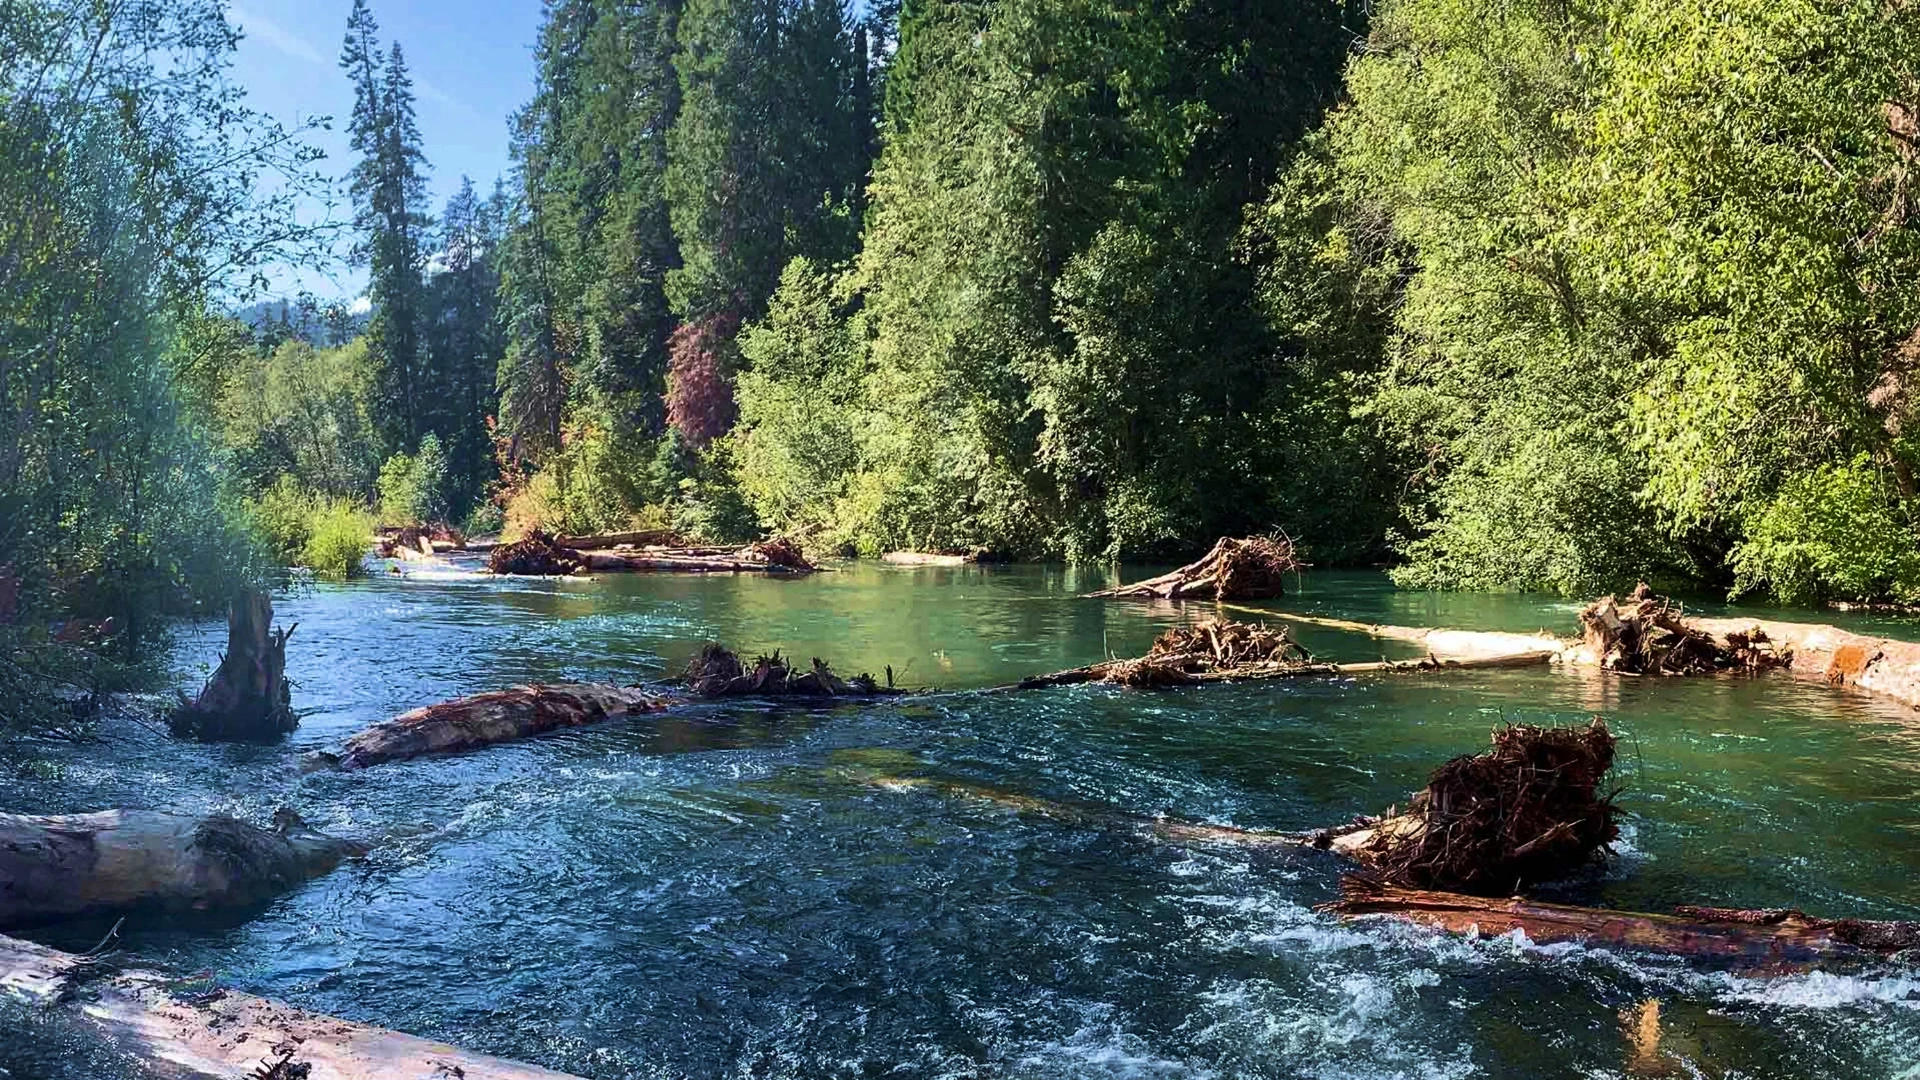
48 restoration projects restored 2.851 billion gallons in 2025
Intel
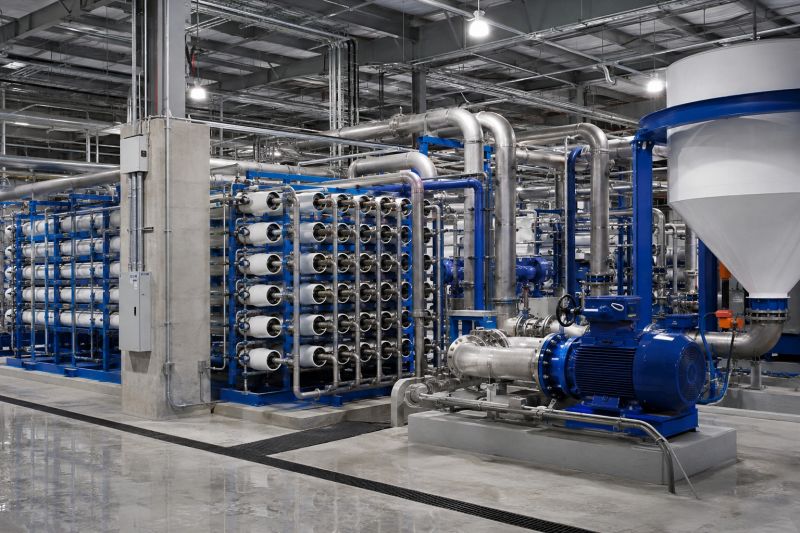
Quincy Water Reuse Utility reduced potable water use by 97%
Microsoft
Net-zero water use for cooling at the Austin campus conserves up to 60 million gallons of freshwater
Apple Inc.
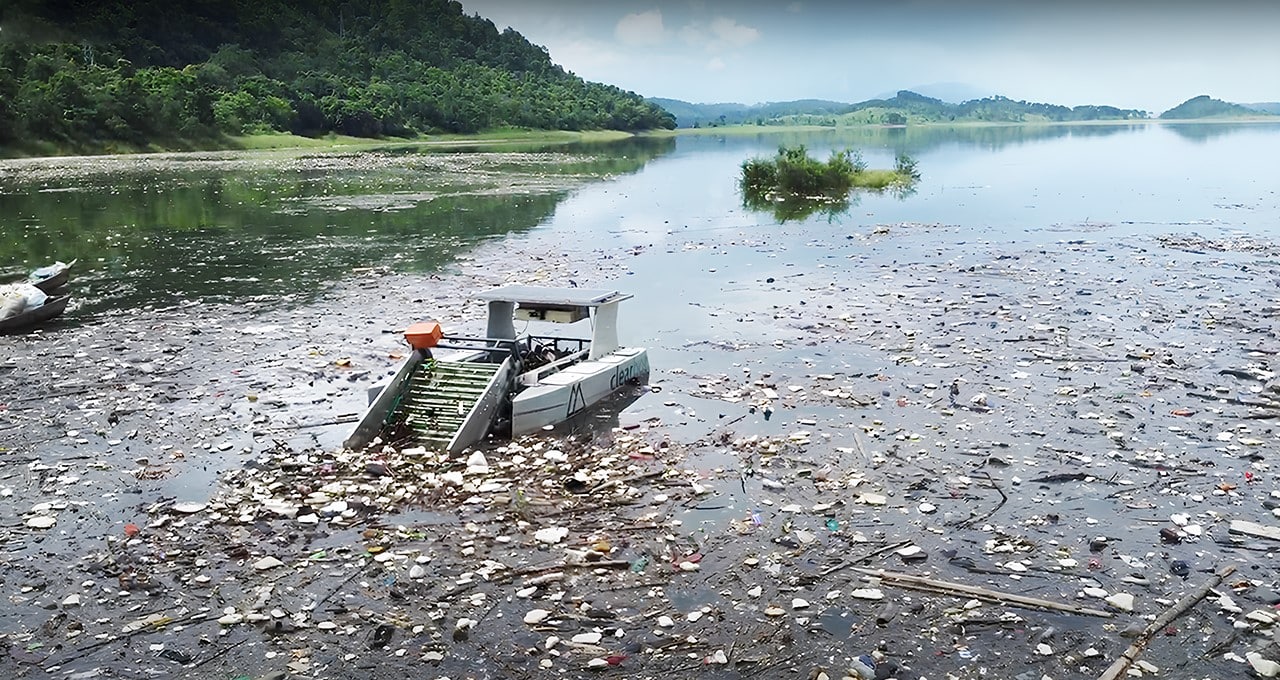
Clearbot autonomous machine removed 1.2 tons of waste per month in Nongstoin, India
NVIDIA
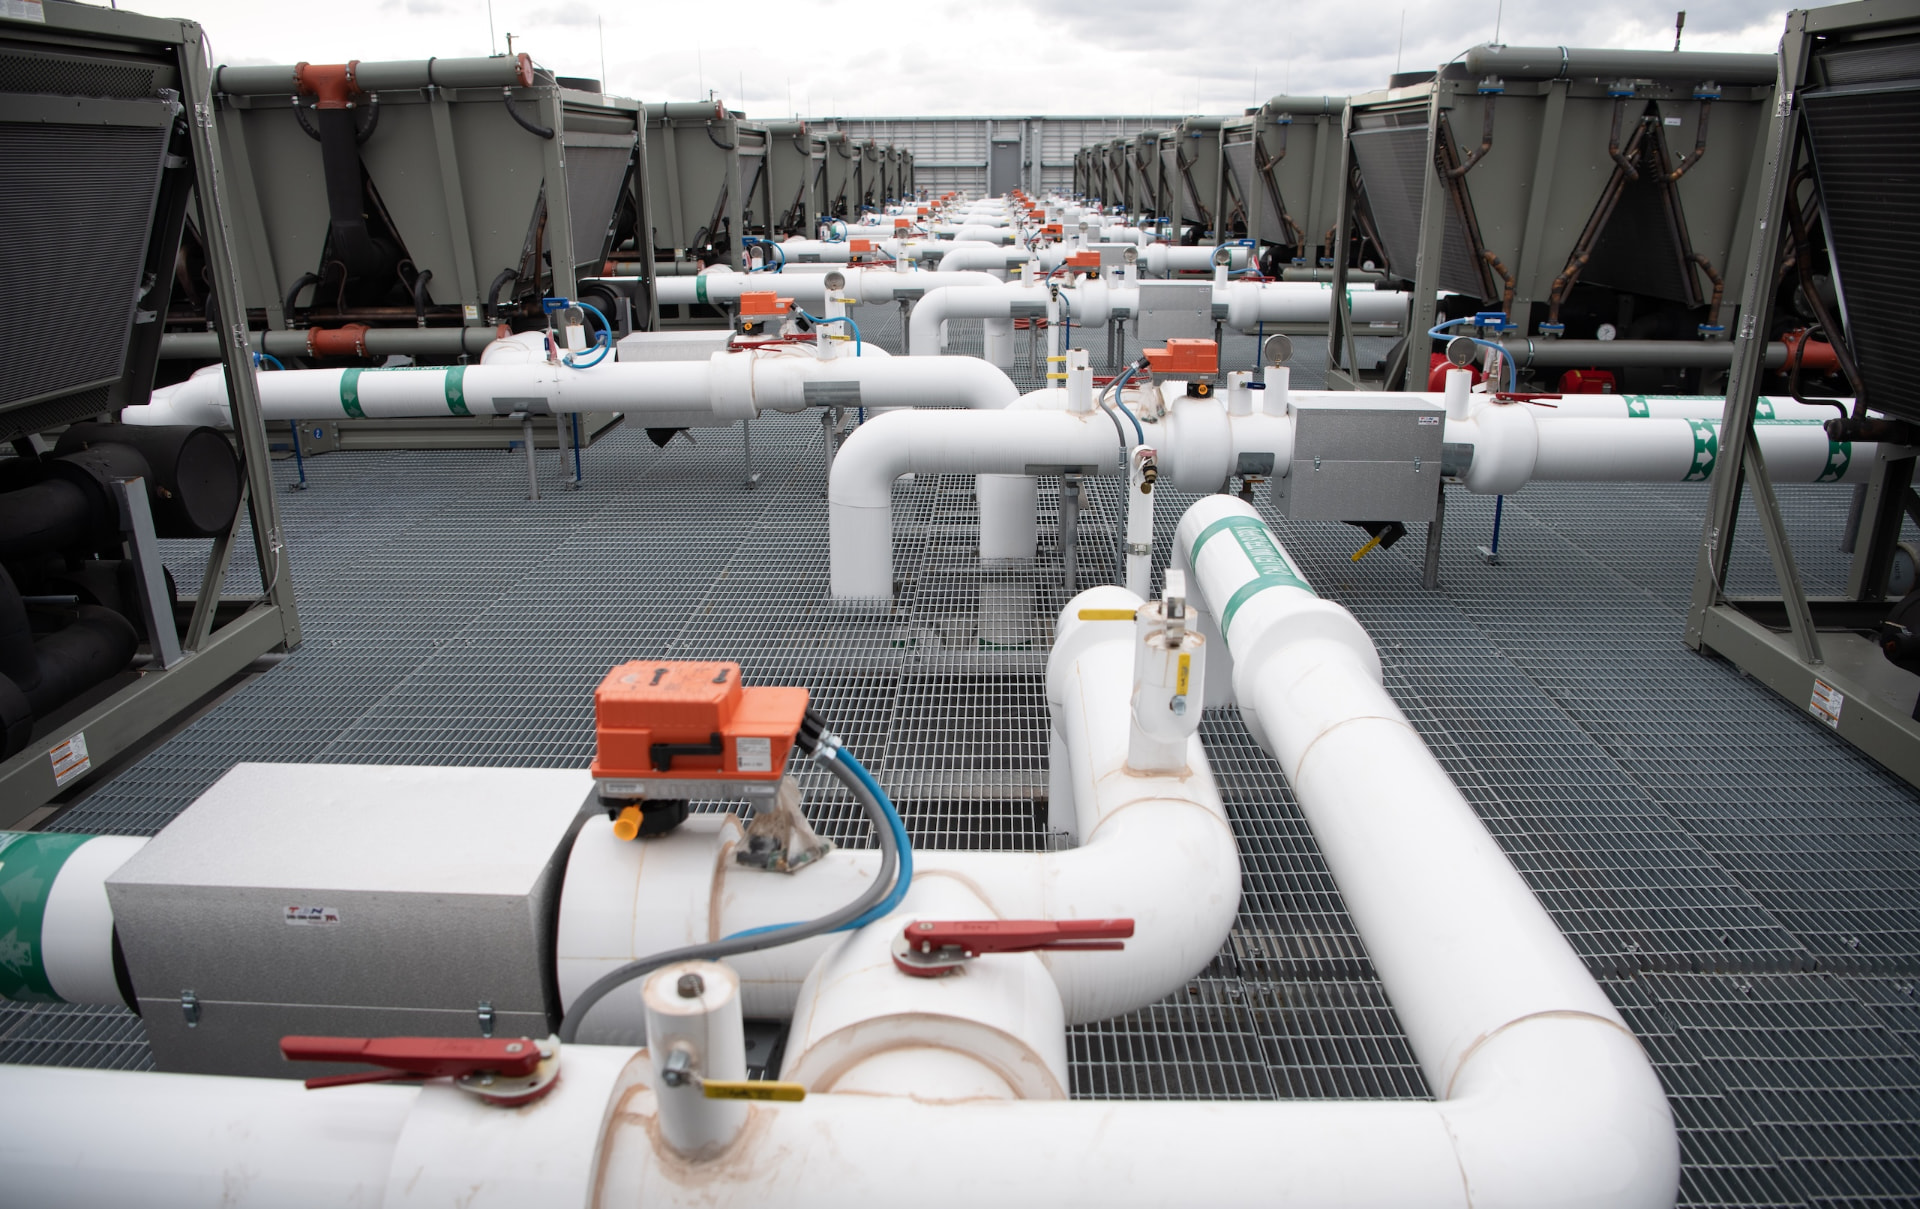
Closed-loop water circulation at the Charlotte facility saved 900,000 gallons annually
Broadcom
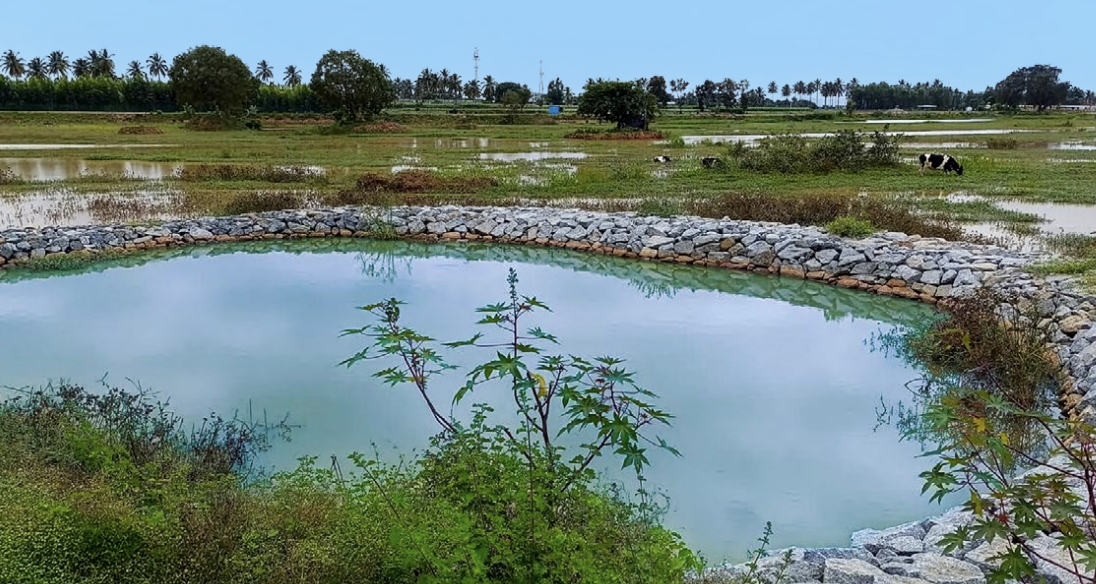
Revitalized two lakes in Bengaluru
Broadcom
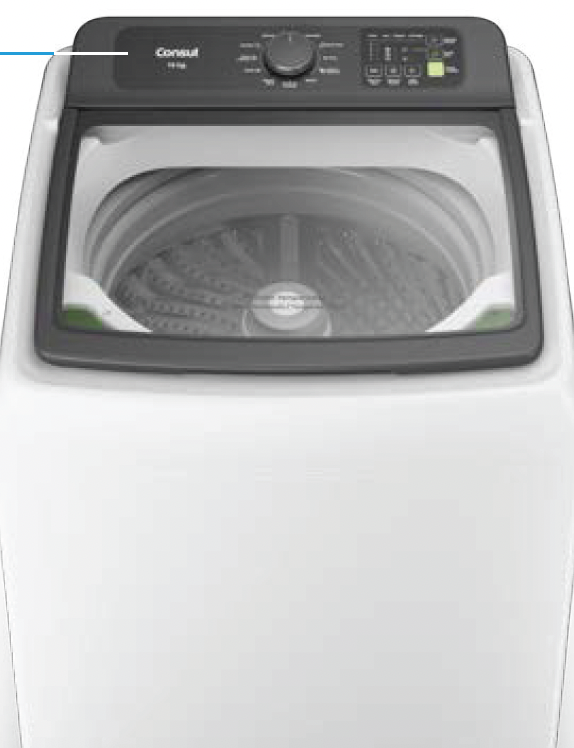
Consul washer's Eco Mode can save up to 15% of water
Whirlpool

All finishes in Nike products are PFAS-free
Nike
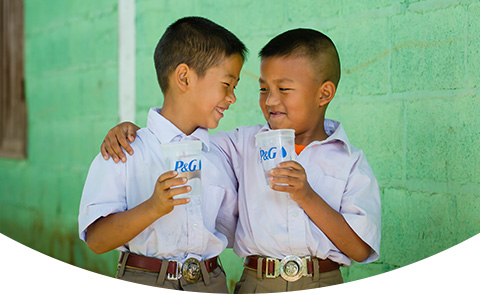
Children's Safe Drinking Water Program providing 21 billion liters of clean water
Procter & Gamble
Corporate water monitoring
Explore 125 companies across 11 sectors. See who reports water use, who measures efficiency, and who reveals exposure to water-stressed regions.
Explore all Corporate Monitoring →What 125 corporate disclosures reveal
H2Oversight research · 2025–2026Water quantity reported
86.4%108 of 125 companies disclosed usable water use, withdrawal, or consumption data.
Water-stress exposure reported
52.0%65 of 125 companies disclosed quantitative geographic water-stress exposure.
Water intensity reported
45.6%57 of 125 companies disclosed a usable water-intensity metric.
Why water matters
Water is a global resource — and a corporate dependency. Read the full context.
Global freshwater withdrawals associated with agriculture
Source · FAO AQUASTAT
Global freshwater withdrawals associated with industry
Source · FAO AQUASTAT
Major corporations analyzed by H2Oversight
Source · H2Oversight research
One framework. Three questions.
Scale
Efficiency
Geographic context
Companies analyzed
Sectors represented
Report all three Key Metrics
Publicly sourced evidence